Home »
Machine Learning/Artificial Intelligence
RMSE: Root-Mean-Square Error in Machine Learning
Root-Mean-Square Error (RMSE): In this tutorial, we will learn about one of the methods to determine the accuracy of our model in predicting the target values.
By Raunak Goswami Last updated : April 16, 2023
What is Root-Mean-Square Error?
The Root-Mean-Square Error (RMSE) is one of the methods to determine the accuracy of our model in predicting the target values. In machine Learning when we want to look at the accuracy of our model we take the root mean square of the error that has occurred between the test values and the predicted values mathematically.
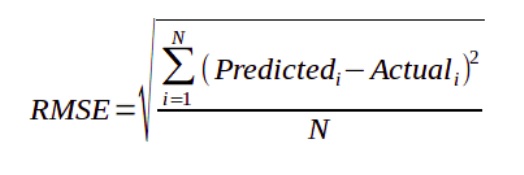
RMSE for a single value
Let a= (predicted value- actual value) ^2
Let b= mean of a = a (for single value)
Then RMSE= square root of b
RMSE for a wide set of values
For a wide set of values RMSE is defined as follows:
Graphically representation of RMSE
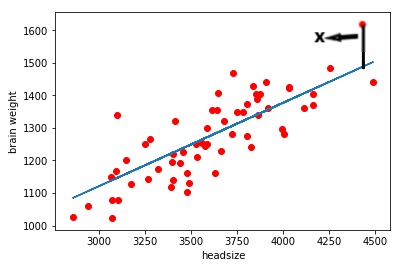
As you can see in this scattered graph the red dots are the actual values and the blue line is the set of predicted values drawn by our model. Here X represents the distance between the actual value and the predicted line this line represents the error, similarly, we can draw straight lines from each red dot to the blue line. Taking mean of all those distances and squaring them and finally taking the root will give us RMSE of our model.
Python code to find out RMSE values of our model
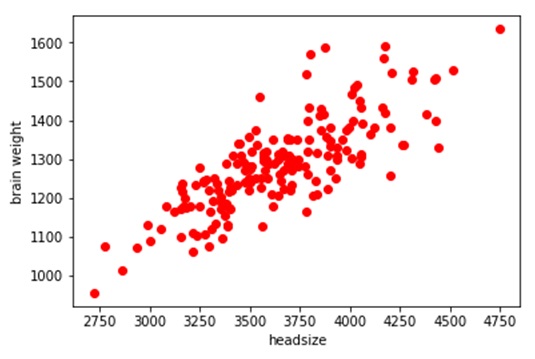
Let us write a python code to find out RMSE values of our model. We would be predicting the brain weight of the users. We would be using linear regression to train our model, the data set used in my code can be downloaded from here: headbrain6
# -*- coding: utf-8 -*-
"""
Created on Sun Jul 29 22:21:12 2018
@author: Raunak Goswami
"""
import time
import numpy as np
import pandas as pd
import matplotlib.pyplot as plt
#reading the data
"""
here the directory of my code and the headbrain6.csv file
is same make sure both the files are stored in same folder or directory
"""
data=pd.read_csv('headbrain6.csv')
data.head()
x=data.iloc[:,2:3].values
y=data.iloc[:,3:4].values
#splitting the data into training and test
from sklearn.cross_validation import train_test_split
x_train,x_test,y_train,y_test=train_test_split(x,y,test_size=1/4,random_state=0)
#fitting simple linear regression to the training set
from sklearn.linear_model import LinearRegression
regressor=LinearRegression()
regressor.fit(x_train,y_train)
#predict the test result
y_pred=regressor.predict(x_test)
#to see the relationship between the training data values
plt.scatter(x_train,y_train,c='red')
plt.show()
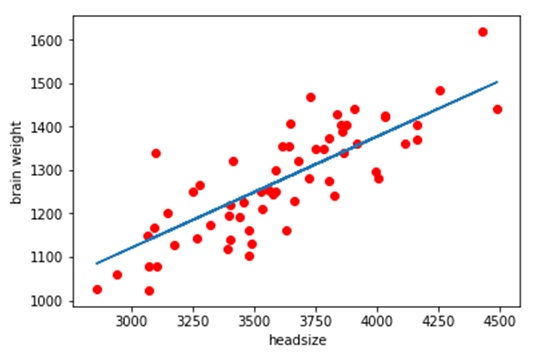
#to see the relationship between the predicted
#brain weight values using scattered graph
plt.plot(x_test,y_pred)
plt.scatter(x_test,y_test,c='red')
plt.xlabel('headsize')
plt.ylabel('brain weight')
#errorin each value
for i in range(0,60):
print("Error in value number",i,(y_test[i]-y_pred[i]))
time.sleep(1)
#combined rmse value
rss=((y_test-y_pred)**2).sum()
mse=np.mean((y_test-y_pred)**2)
print("Final rmse value is =",np.sqrt(np.mean((y_test-y_pred)**2)))
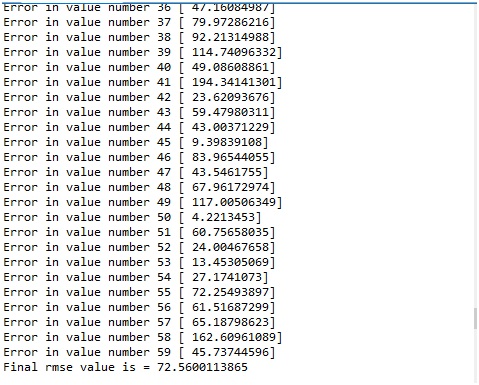
Outputs:
The RMSE value of our is coming out to be approximately 73 which is not bad. A good model should have an RMSE value less than 180. In case you have a higher RMSE value, this would mean that you probably need to change your feature or probably you need to tweak your hyperparameters. In case you want to know how did the model predicted the values, just have a look at my previous article on linear regression.